


Hi everyone, welcome to this week's blog, we are halfway through our Bootcamp. This blog is about World cup analysis. The World Cup was founded in 1930 and it has been held every four years except in 1942 and 1946 due to the Second World War. The aim of the organizers was to host championship matches between professional leagues from different nations. Currently, 32 countries participate in the world cup and the world has witnessed only 7 winners in the tournament so far. This study aims to project visuals on Football World Cup Analysis using data from 1930 to 2018, scrap, and clean data, then visualize the dataset with PowerBI and Excel. PROJECT OBJECTIVES For this project, we will be using both Excel and PowerBi to create a Football World Cup analysis report and dashboard showing details of attendance and subsequent analysis per country. This will be achieved by visualizing the following metrics. • Most Number of World Cup Winning Title • Attendance, Number of Teams, Goals, and Matches per cup • Goals Per Team Per World Cup • Matches with the highest number of Attendance • Stadium with Highest Average Attendance • Countries who had won the cup from 1930 till date • Number of goals per country • Match outcome by home and away
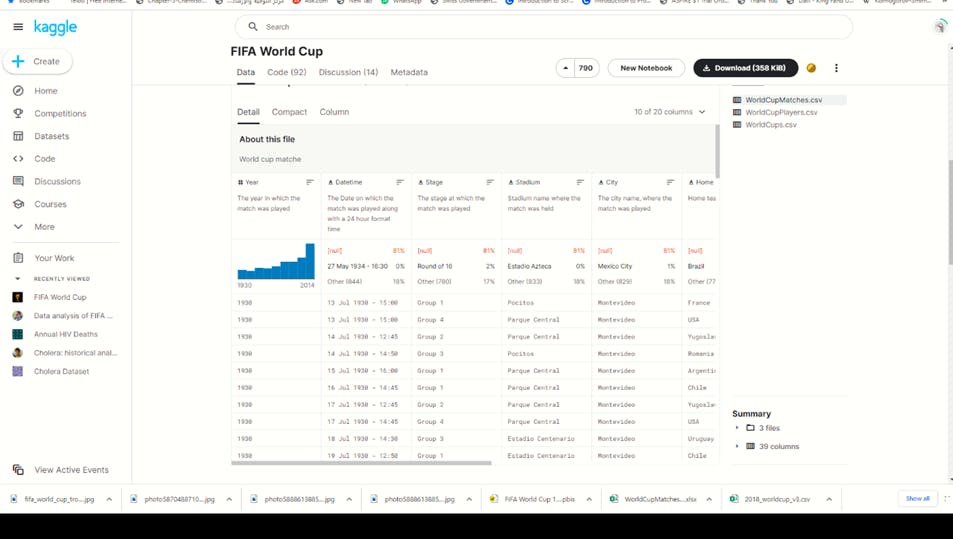
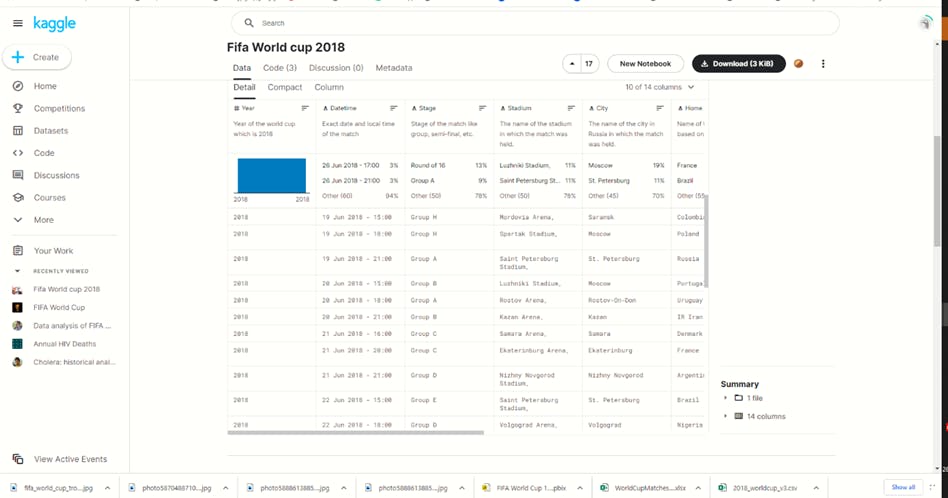
DATA SOURCING Data scraping was easy for us this time because of the problem encountered and experience gained during the last project data source, although the data we got had some columns we did not need for our visualization, we also discovered that we needed to research for each world cup stadium attendants which are missing from our available data set without which we can’t achieve our project objectives. Both datasets were gotten from Kaggle kaggle.com/datasets/rezaghari/fifa-worldcup.. and kaggle.com/datasets/rezaghari/fifa-worldcup.. respectively
DATA CLEANING Our dataset required a lot of clean-up, the clean-up was majorly done using Microsoft Excel thereby resulting in two different excel sheets, it was then imported to power bi to transform into our final visualization.
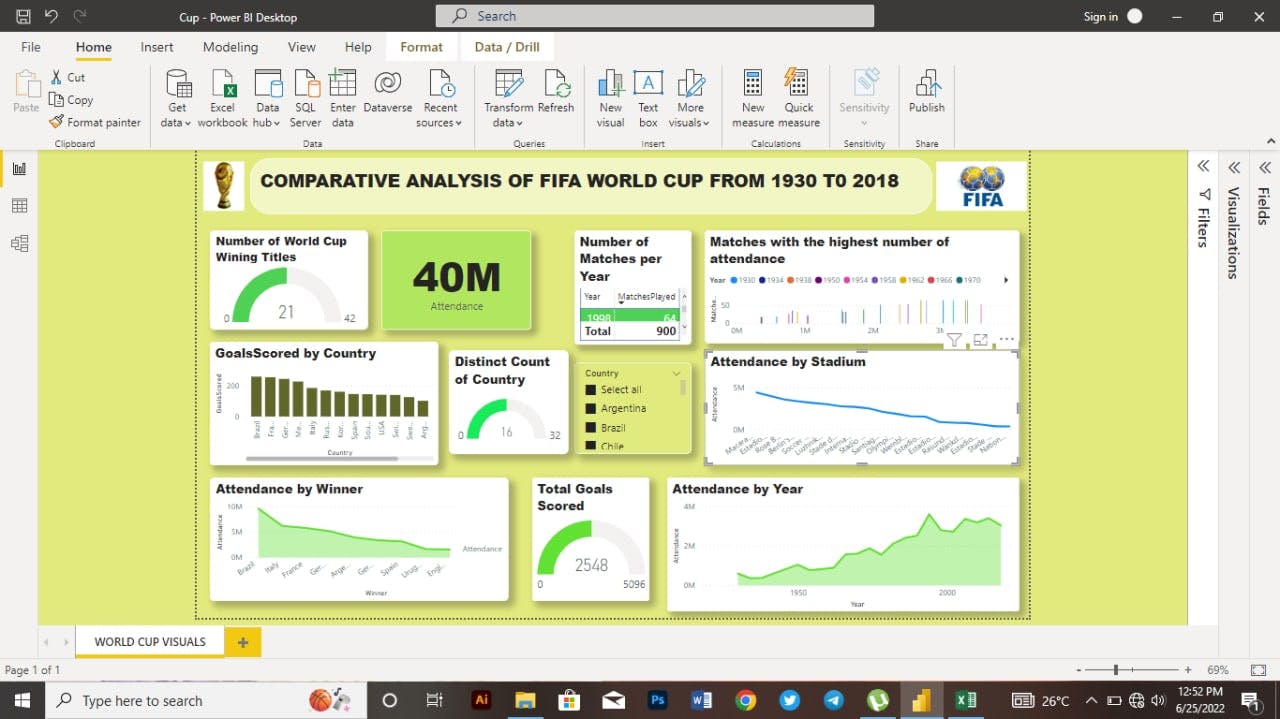
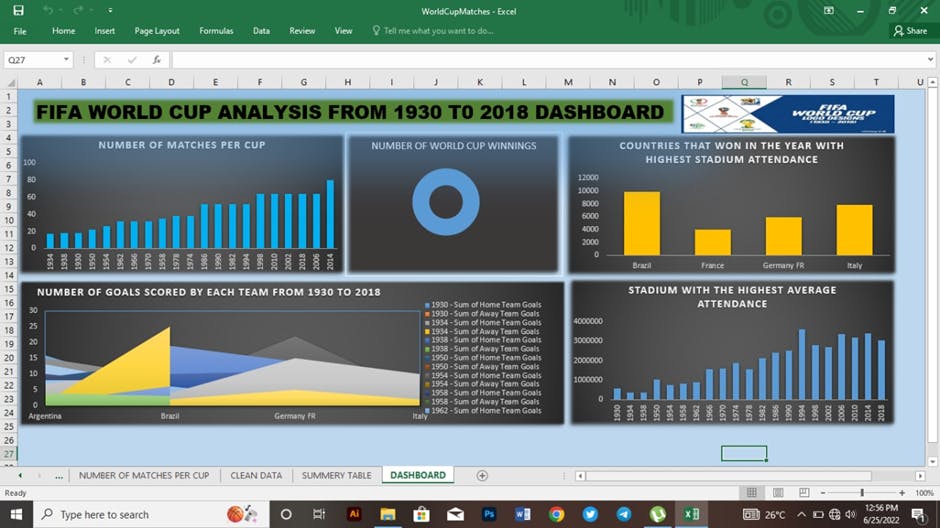
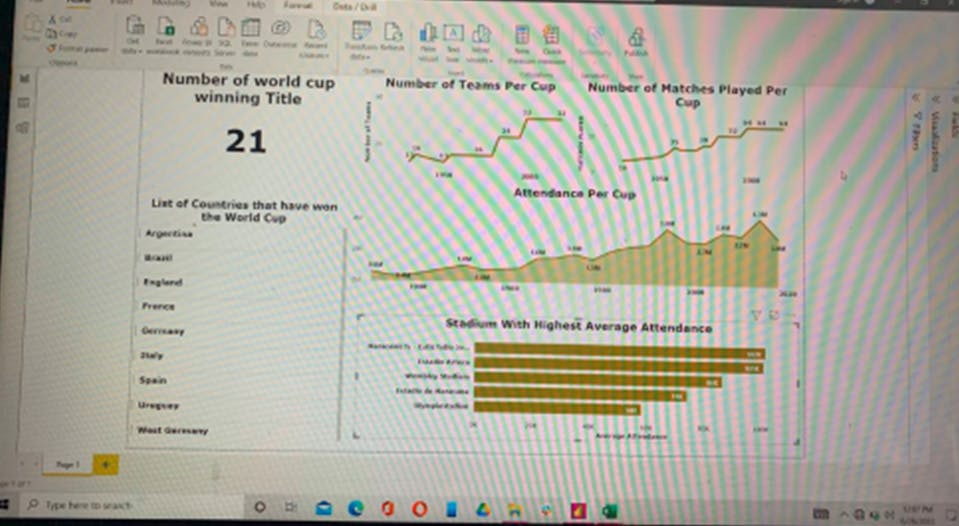
ANALYSIS Our analysis shows that; Brazil is the most successful World Cup team with five titles and the only team to have played in every tournament. France and Brazil have the highest number of goals scored, 8 countries have won the cup since the world cup started. The 1994 World Cup holds the record for the highest total attendance with over a 3.5million people at Maracana stadium. The total goals scored throughout the world cup is over 2500 RECOMMENDATION As Brazil is the most decorated world cup winner, other teams could adopt approaches that have to enabled Brazil to achieve feats. Teams should look into how Brazil national teams select players, the training technique they adopt, and the various competitive matches they engage in.
I hope you enjoyed reading this because we sure enjoyed working on the project! See you next week.