
Our Week Four Project
AIRPORT OPERATIONAL PERFORMANCE MEASURES ANALYSIS


Week four is so far the toughest for us in this journey. Nevertheless, it took us to a different level of researching and engaging our analytical thinking skills as Data Analyst. We were saddle with the task to work on Airport Operational Performance. It took us about 5 to 6 days out of the 7 days to get reasonable data set to work with even though it is not exactly what we wanted to have. So, I will not be wrong by saying at end of my internship and Boothcamp experience with @NgSidehustle I can boldly defend my ability to work under little or no supervision and most importantly ability to work under pressure 🤕. As a Data Analytic Intern, this week's project was to work on Airports Operational performance analysis. We literally turned the internet upside down looking for Data set that we could use to get the exact deliverables expected of us. After searching for a whole week My team and I decided that we cannot let all our efforts go unnoticed by not submitting anything simply because we couldn't get exact data for our project. We decided that we must work on a project that is in line with is expected of us. So, we use one of the Data sets to work on Annual performance measures for Austin-Bergstrom International Airport From our dashboard you could easily realize that year 2014 had higher operating revenue compared to the previous two years. t.co/MrBDdSrKGP
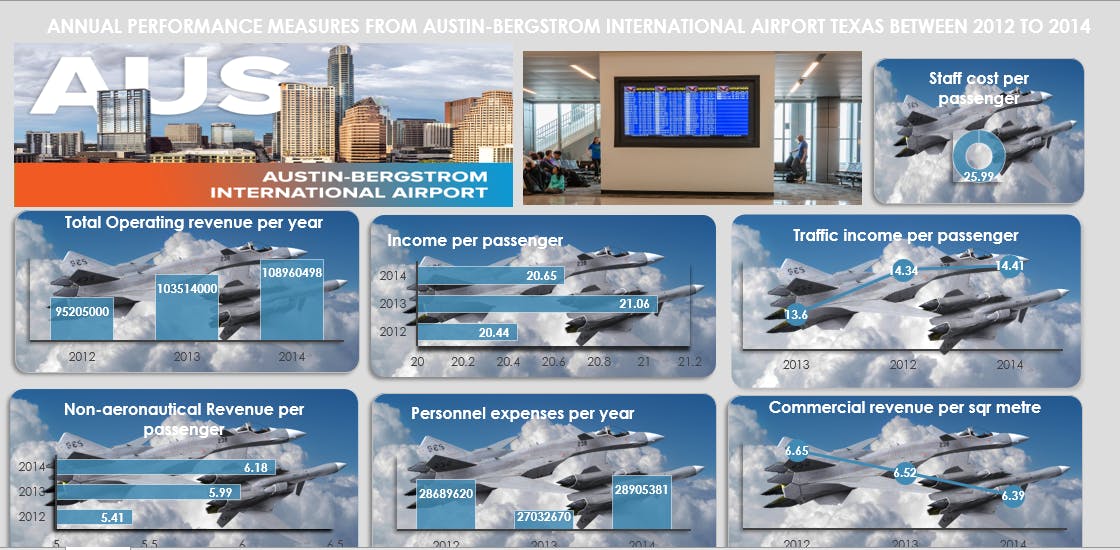
Although the year 2013 had the highest revenue per passenger and the whiles the year 2014 recorded improvement in almost every segment of the general Airport Operational Performance. It's been a very tedious learning experience with @NgSidehustle but we are definitely not complaining as it's making us understand how much we have inside of us. Literally every new week I personally discover how much I can stretch over my supposed limitations. Again, we analyze Aircraft incidents and their causes so as to know details into locations with highest incidents, nature of the Aircraft and how fatal the incident was. This was done using a different Data set. The dashboard bellow shows that New York had the highest incidents and Collision fatalities is higher than ground fatalities. t.co/OhWozqcJyX
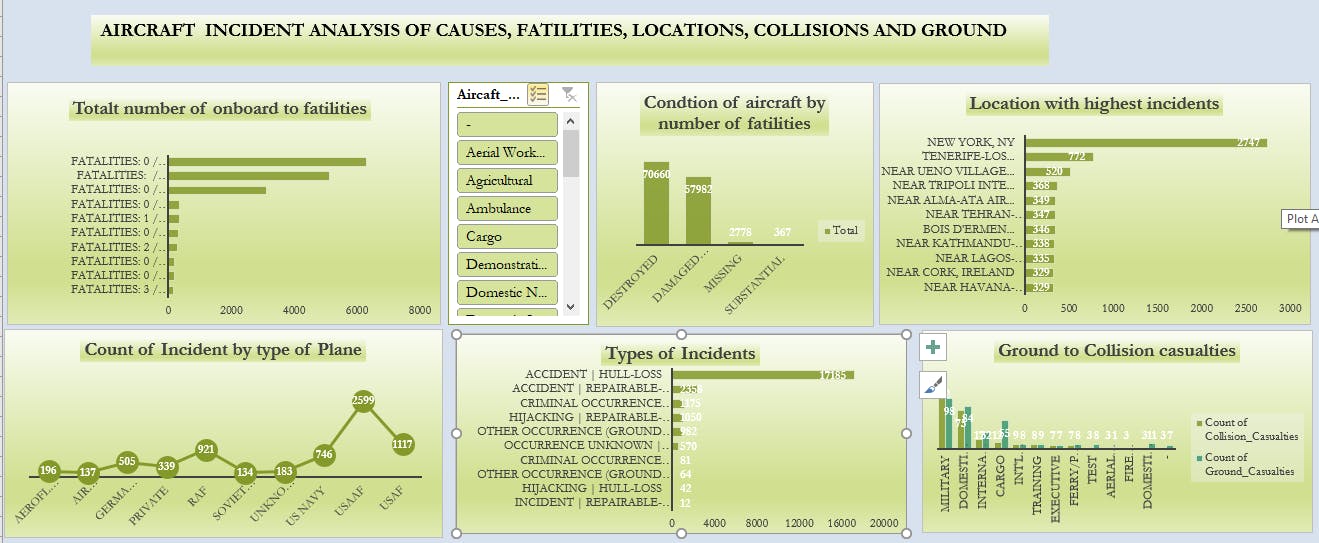
Aircraft that were destroyed had the highest fatalities followed by damaged Aircrafts and Missing Aircraft is the third in recording fatalities. And so, I say it this again at end of my internship and Boothcamp with @NgSidehustle I can boldly say I can work under pressure with little or no supervision and I will definitely deliver tangible results.
Thank you for reading all through. And please do well to give us your reviews and contributions.